This solution will save a lot of time compared to measuring and setting up completely manually.

Basics of Analog Signature Analysis (ASA) – Analog characteristic curve analysis
The Huntron Tracker generates a precise AC current-limited sine wave signal to a component and displays the resulting current flow, voltage drop, and any phase rotation on the device display. Current causes a vertical beam on the screen, while voltage across the device generates a horizontal beam. The beam that displays the results on the screen is called the analog curve.
Understanding the ASA core circuit is the key to understanding how the analog curve responds to different types of components. ASA is sometimes called “V/I characteristic measurement”, and since the current generated is a function of the circuit’s impedance, the displayed analog signature can be considered a visual representation of Ohm’s Law.
V = IR where V = voltage, I = current and R = impedance
The following figure shows a simple diagram of the ASA core circuit. The sine wave generator is the test signal source and is connected to a resistor divider made up of Rs and RL. The load impedance, RL, is the impedance of the component being tested. RL is in series with the internal or source impedance of the Tracker, Rs. Because Rs is constant, both the voltage across the device under test and the current passing through it are a function of RL.

Each test signal or measurement range has 3 parameters: source voltage Vs, Impedance Rs, and source frequency Fs. When using ASA for diagnosis, the measured object will select the display range so that the information of the analog curve is most precise. Huntron Tracker can easily do this by changing the appropriate range parameter. The source voltage Vs of the test signal can be used to enhance or bypass the semiconductor’s switching characteristics and Avalanche effect. The Fs or frequency of the source test signal can be used to strengthen or bypass the resistance (capacitance or inductance) of a single component or circuit node. Rs or source resistor is utilized to match the impedance load under test and provide the best possible curve.
Four basic types of similar component characteristic curves
All analog curves are in the combination of one or more of the four primary device curves: impedance, capacitance, inductance, and semiconductor. Refer to the figure below. Each of the basic components responds differently to the device’s test signals. Recognizing these unique underlying signal patterns on the device display is the key to using ASA diagnostics. When components are connected to form an electrical circuit, the characteristic curve of each circuit node is a combination of the basic characteristic curves of the components in that circuit. For example, a circuit with both impedance and capacitance will have a curve that combines the similar curves of the resistor and capacitor. The resistor’s characteristic curve is always displayed as a straight line at an angle from 0 to 90 degrees. The characteristic curve of a capacitor is always circular or elliptical. While the inductor is also circular or elliptical, it also has internal resistance. The characteristic curve of a semiconductor is always made up of two or more linear curves, usually in the shape of a nearly right angle. The characteristic curve of a semiconductor device can indicate the conductivity of both forward and reverse bias. This will create a Zener semiconductor diagram showing all the branch points.

How the same characteristic curve is obtained
The curves shown in this document are those using ASA equipment manufactured by Huntron. Inc. for most curves shown in this document using two probes. The probes are held directly onto the component or between the component pins and a common reference point, such as ground or Vcc on the board.

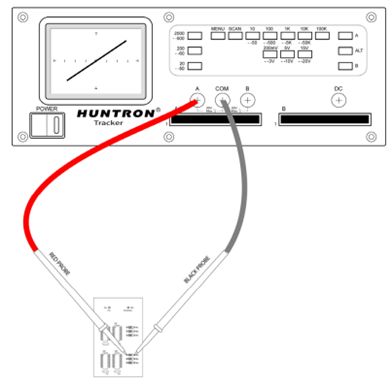
The picture above is a typical application of measuring a component using a probe with a component as a resistor. One red probe is connected to channel A, and the other one (black probe) is connected to the Common pin.
Channel A and Channel B are connected as test signals or signal connectors. Actual test signals are applied through those connections.
The Common port is the signal reference or “response signal” port. This is sometimes known as a reference to “the ground” through the Common port, which can be attached to any point on the board.
Compare objects that are performing well and suspect objects
In most cases, a similar curve analysis is used for comparative error finding. This means that the printed circuit board characteristic curve (PCA) in good condition is used for comparison with the suspect PCA. Different curves may indicate a potential problem. Typically, channel A is used for positive PCA, and channel B is used for suspect PCA.
There are two channels of the Huntron Tracker, channel A and channel B. These channels are selected by pressing the corresponding button on the device or selecting the appropriate channel on the Huntron Workstation software.

When using a single channel, the red probe should be plugged into the corresponding channel test output, and the black probe or common lead should be plugged into the Common test port. When testing, the empty probe should be connected to the positive output of a device (e.g. Anode, +V, etc.) and the black probe should be connected to the negative terminal of the device or a general reference point (e.g. cathode, soil), following the above procedure to ensure that the signal curve appears on the quadrant of the screen.
Typical comparison curves are shown in the figure below. Blue is the curve of the good component, and red is the curve of the suspect component.

The figures above show a good versus bad curve (green is good, red is bad). The characteristic lines on the left figure show that the Transistor component has been damaged (leaked) compared to the component that is operating normally. The characteristic line on the right shows the inductor with a twisted winding.

The figures above show the good curve versus the bad state (green is good, red is bad). The characteristic lines on the left figure show the signal on the output of IC pin 74S04 and the damaged output pin. The figure on the right shows a good capacitor compared to a leaky capacitor inside.
Parameters are controlled
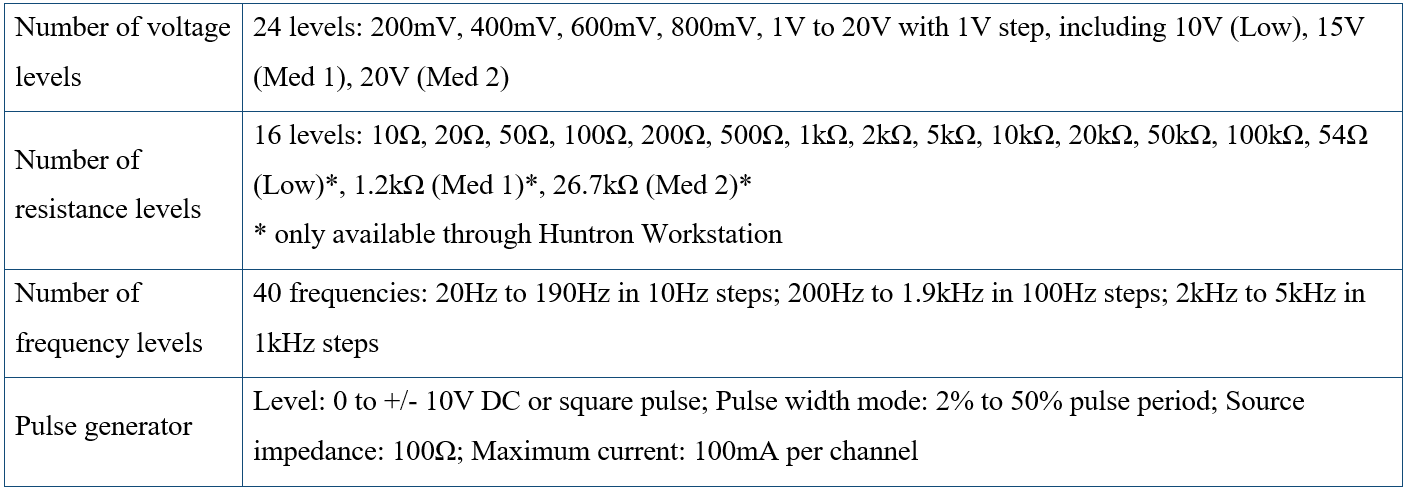
The table below shows the parameters that can be selected on the machine or in software.

Automation – increase efficiency
In addition to manual measurement equipment, Huntron also provides the Access Prober System to help automate testing, which is highly suitable for testing large quantities of circuits or storing data available for rare boards.

The Huntron Access Prober device can automatically measure pulses up to 56 x 58 cm in size with an accuracy of up to 10 microns.
Firstly, we need to define the test locations and test components for the measuring probe. After obtaining the position data, the machine conducts the first measurement and collects characteristic curve data of the measurement positions. Once we have these parameters, we can easily install a new board or test object for evaluation.
This saves a lot of time compared to completely manual measurements and settings.
Our company always wishes to become a reliable partner and a leading supplier of equipment and solutions for the success of our customers. For more detailed information, please contact:
MITAS Hanoi Technology JSC
Address: 5th Floor, C’Land Building, No. 81 Le Duc Tho St., My Dinh 2 Ward, Nam Tu Liem Dist., Hanoi, Vietnam
Web: https://mitas.vn | Tel: (+84) 243 8585 111 | Email: sales@mitas.vn
The trust and support of our customers are a driving force and an invaluable asset to our company. We sincerely thank you./.
